In class, we were asked to review websites from a list in order to identify how they portray digital history. We examined Visualizing Emancipation, The Spread of U.S. Slavery, 1790-1860, and Virginia Secession Convention.
While all three websites conveyed information about slavery in the United States, each one used a different format to display its content. One of the websites that particularly caught my focus was Visualizing Emancipation. While I found the overall layout of one long, scrolling home page to be tiresome, I really appreciated the simple aesthetic of the website overall. I also found the mixture of maps, graphs and statistics with classic textual information really compelling.
Below, are three examples of the website’s use of mixed media and simple, reader-friendly textual information:
This would be a great model to base my own work in the class because my project is going to also be based on a collection of historical data and information.
To further understand this website, I consulted the Organization of American Historian’s guidelines. It provided me with a deeper understanding of this website, and allowed me to gain a deeper understanding of the type of project I am looking to create.
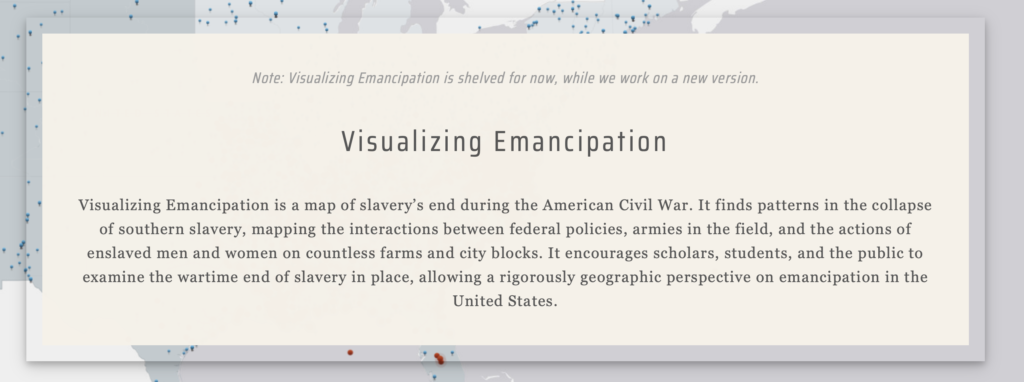
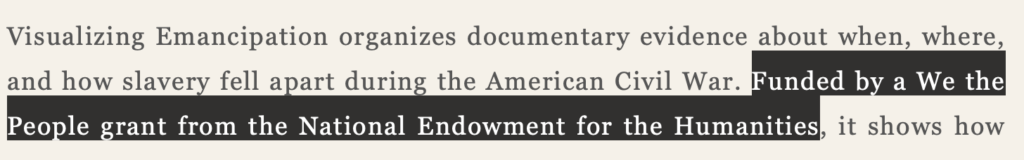
Based on the different categories of genre listed in the guidelines, it is clear Visualizing Emancipation is primarily, both a Digital Narrative as well as a Teaching Resource. As stated on the website, it “organizes documentary evidence about when, where, and how slavery fell apart during the American Civil War ” and “shows how emancipation occurred unevenly across the South, beginning before the first major battles and ending after the end of the Confederacy”.


In addition to categorizing the different genres of digital history projects, the Organization of American Historian’s guidelines also notes the five areas most reviews will address.
The first, content, asks if the scholarship is sound and current, how well it is communicated, and to identify the point of view. The ‘About’ section of Visualizing Emancipation identifies the scholarship of the project by stating funding by a “We the People grant from the National Endowment for the Humanities“. (figure 1.a) While sound, this scholarship is not current, as the website states on the top of the ‘Home’ page that a “New Version” is currently being worked on by the University of Richmond, the producer of the original site. (figure 1.b)
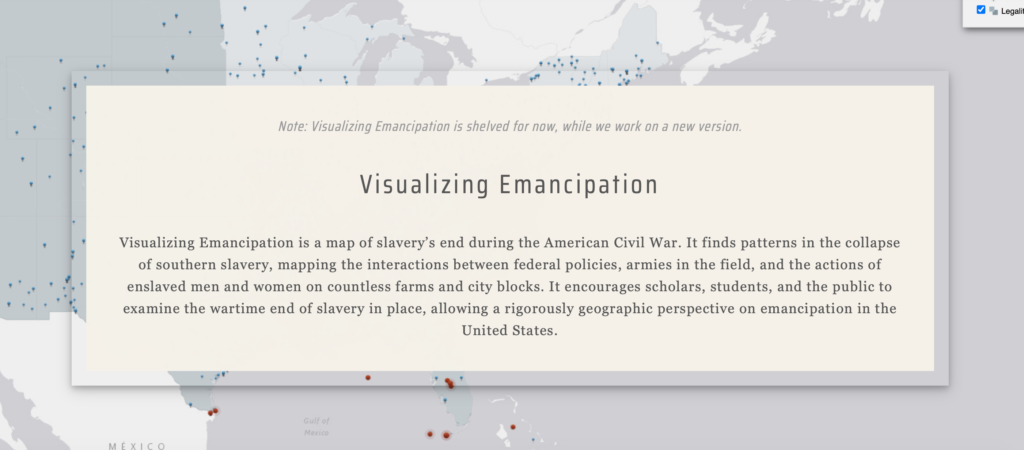
The next area, design, first asks if the website’s layout clearly communicates what is found on the site. We also look to see if there is a clear, effective, and original design. The highlight of this website’s design is the clear communication of its topic, as the opening text box clearly states the purpose of the site and what is to be expected while viewing. The design of this website is very simple, aesthetically pleasing, and clear. This makes it very effective.
Next, it is asked if the structure makes it easy for users to navigate and if all the sections function as expected. The structure of the website appears as one fluid page of content, but their is an easy-to-navigate and working ‘Menu’ in the header that also scrolls with the page. (figure 2.a) Most of the mixed media is not interactive, and is easy to save or share independently, and the ‘Animations’ posted on the website are simple to interact with. (figure 2.b)

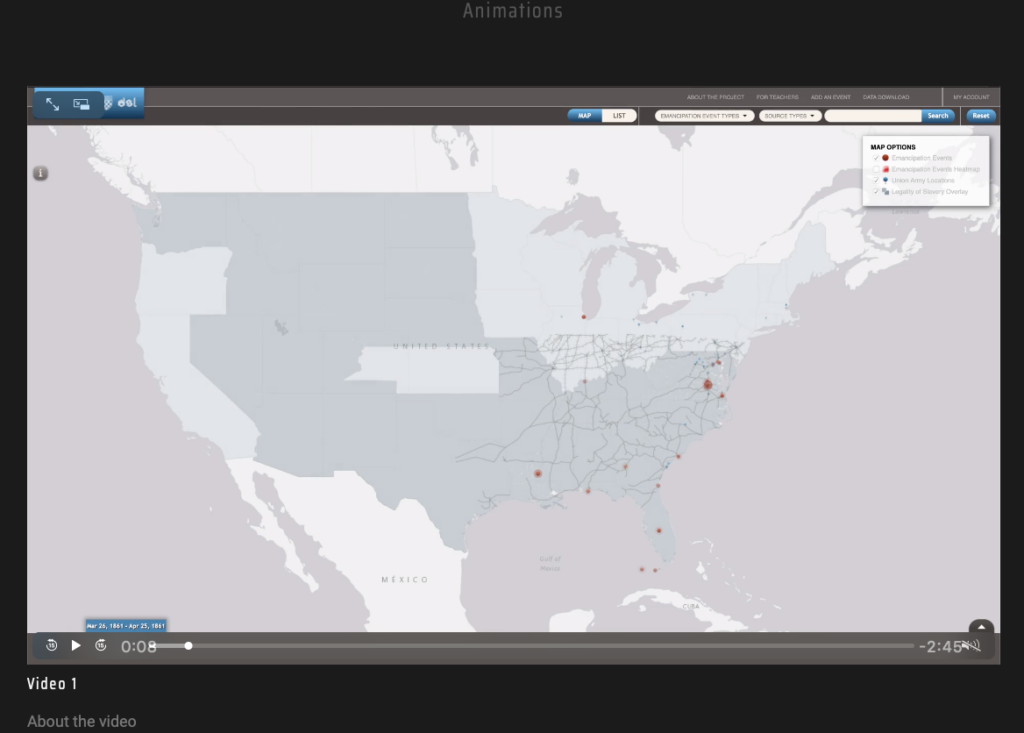
Finally, we look to see if the website is accessible, to people of all abilities, as well as to all devices. The website’s font can be increased manually via the user’s personal computer, but the website does not posses any special features to simplify the website viewing experience for anyone with sight or hearing disabilities. The font is fairly small and the ‘Animations’, while they do not have any sound, do not indicate they are soundless or provide a Closed Captions option to clarify this. In terms of devices, the website is mobile-friendly but the layout could be improved as the text is much more scrunched together (figure 2.c) and the ‘Animations’ do not display with the maps in the icon, rather they appear black until clicked. (figure 2.d) I did however like how the menu could be clicked in the righthand corner and enlarged versus being listed out in the header, this made it easier to select a section to auto-scroll to.
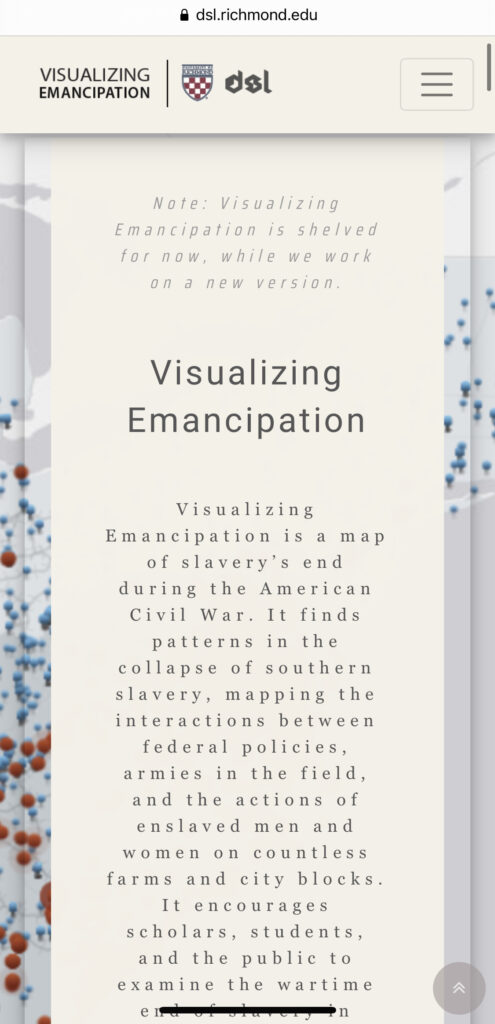
figure 2.c 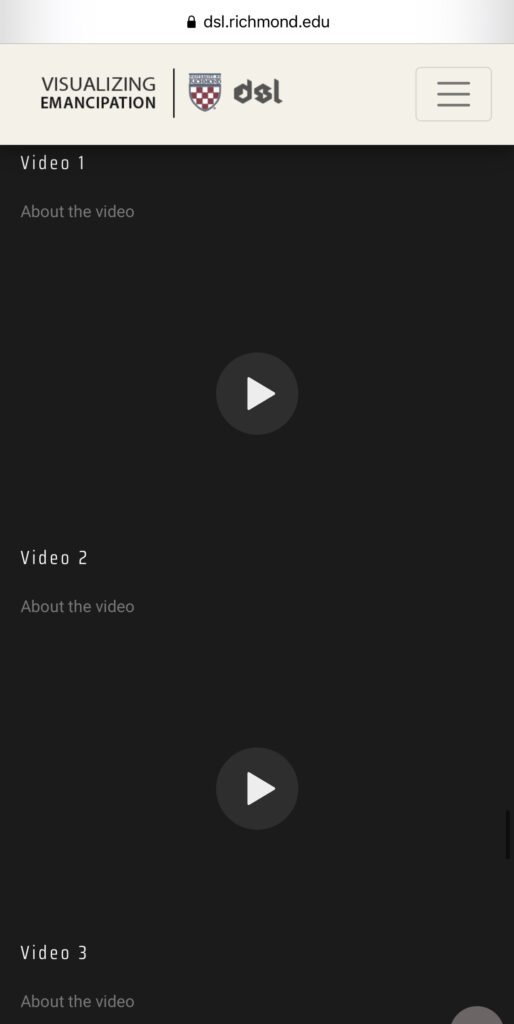
figure 2.d 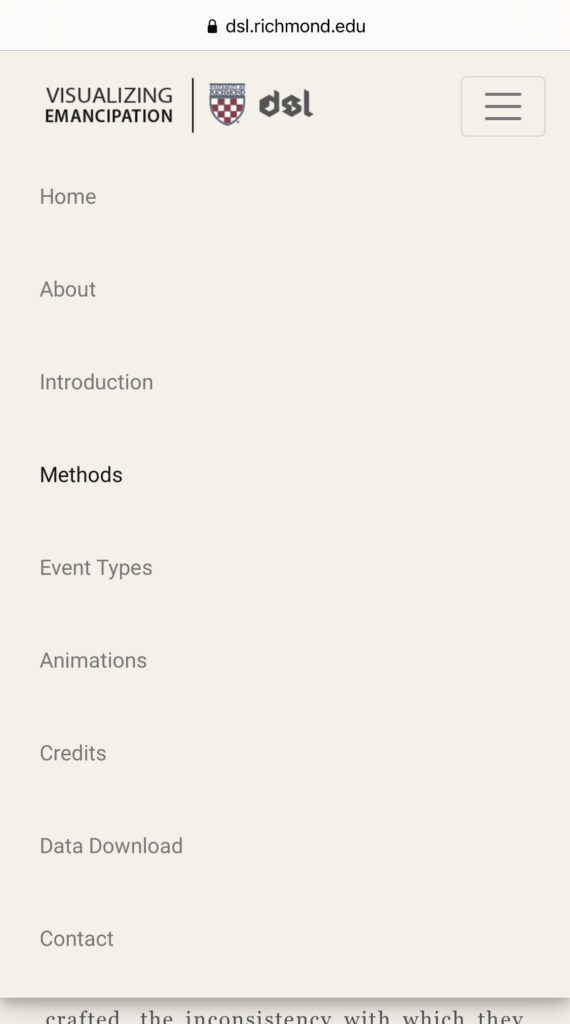
figure 2.e
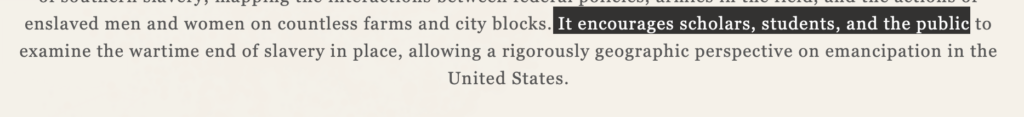
The next area is audience: is the project clearly directed at anyone and how well does it address that audience’s needs. The introduction makes the audience of this project clear by stating it is for scholars, students and the public’s examination of slavery’s wartime end. It addresses the needs of these audiences well by including a wealth of scholarly information that could be applied to a variety of fields of research or various needs.
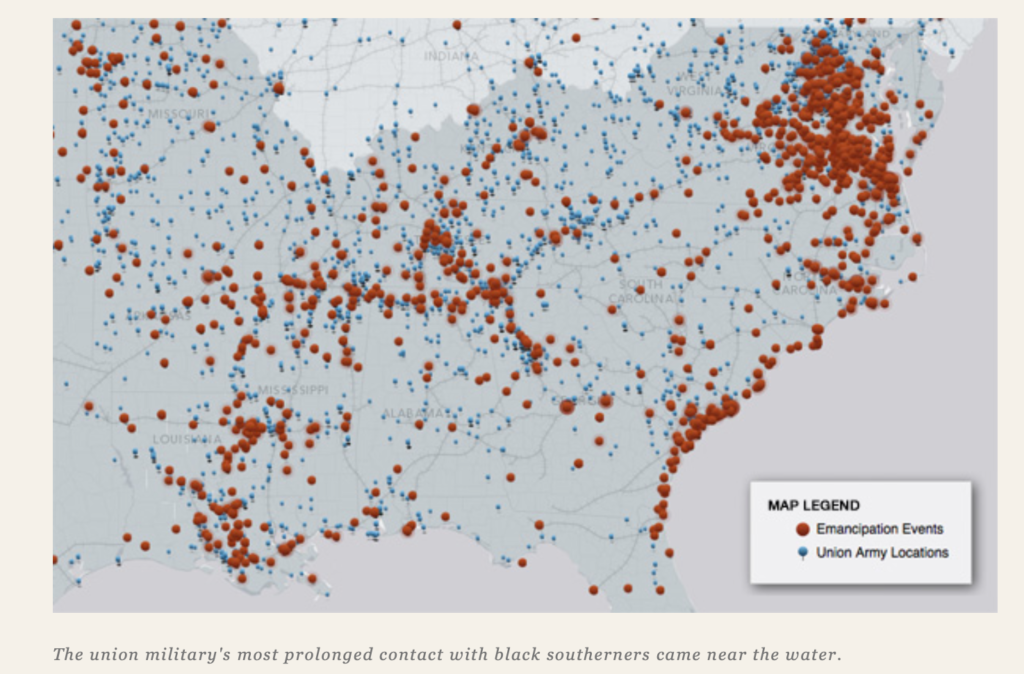
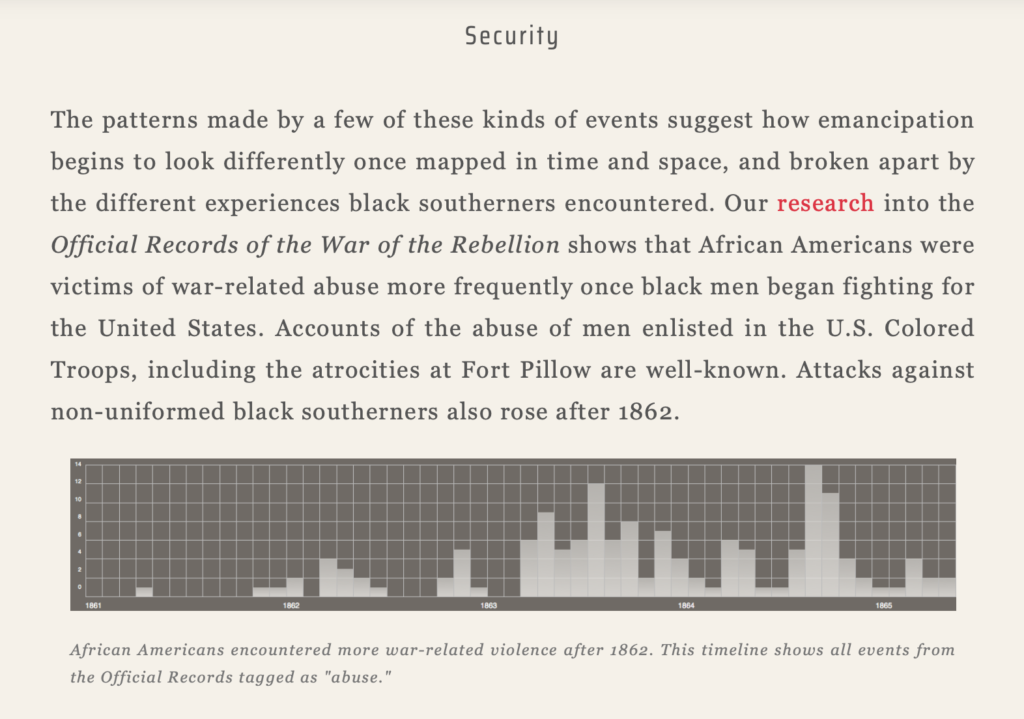
Then comes the question of digital media: is digital media and new technology used effectively, and does it do something that could not be done in other media—print, exhibition, film? The use of digital media in this project is sparse, but thought use of the two maps (figure 4.a,b) , two graphs (figure 4.c,d) and eight videos in the website (figure 4.e), it does effectively convey the project’s purpose.
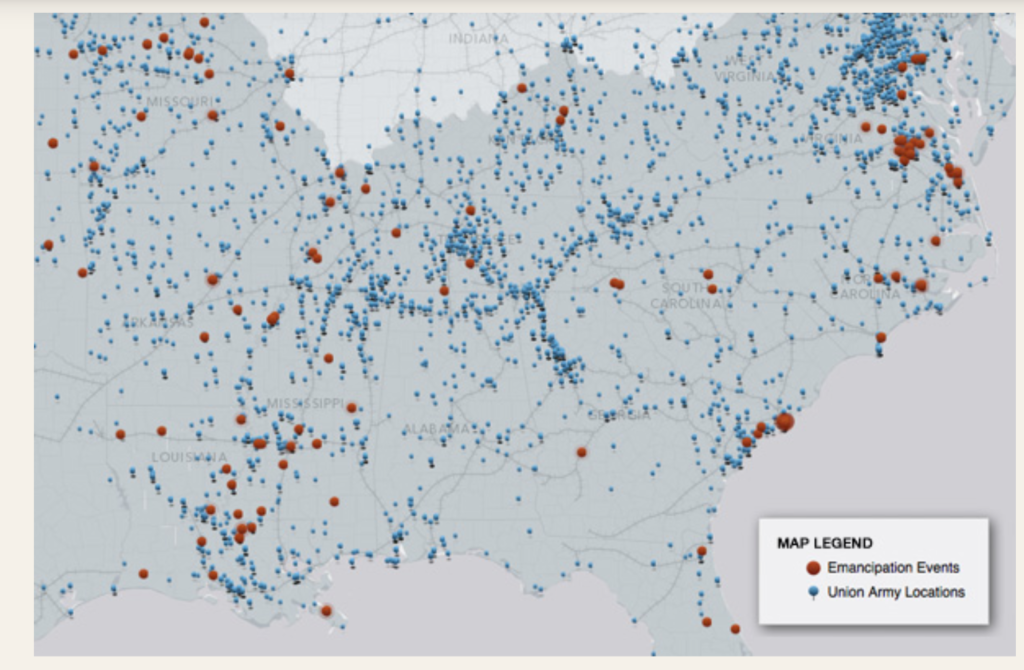
figure 4.a 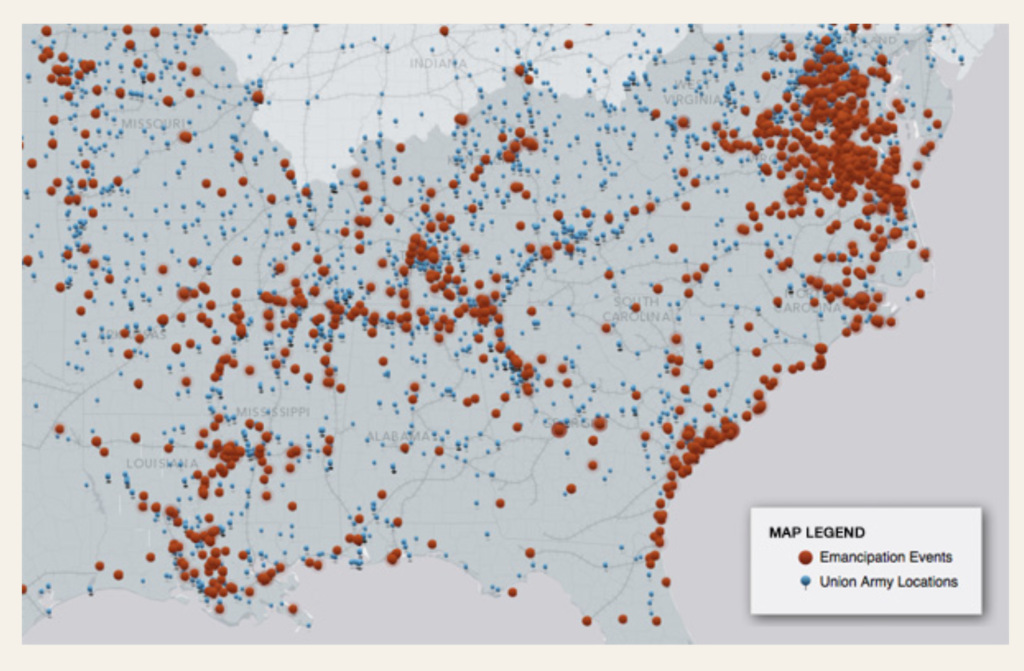
figure 4.b
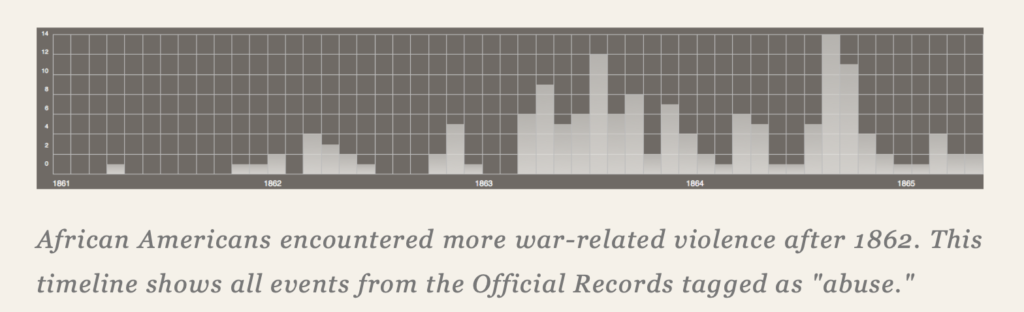
figure 4.c 
figure 4.d 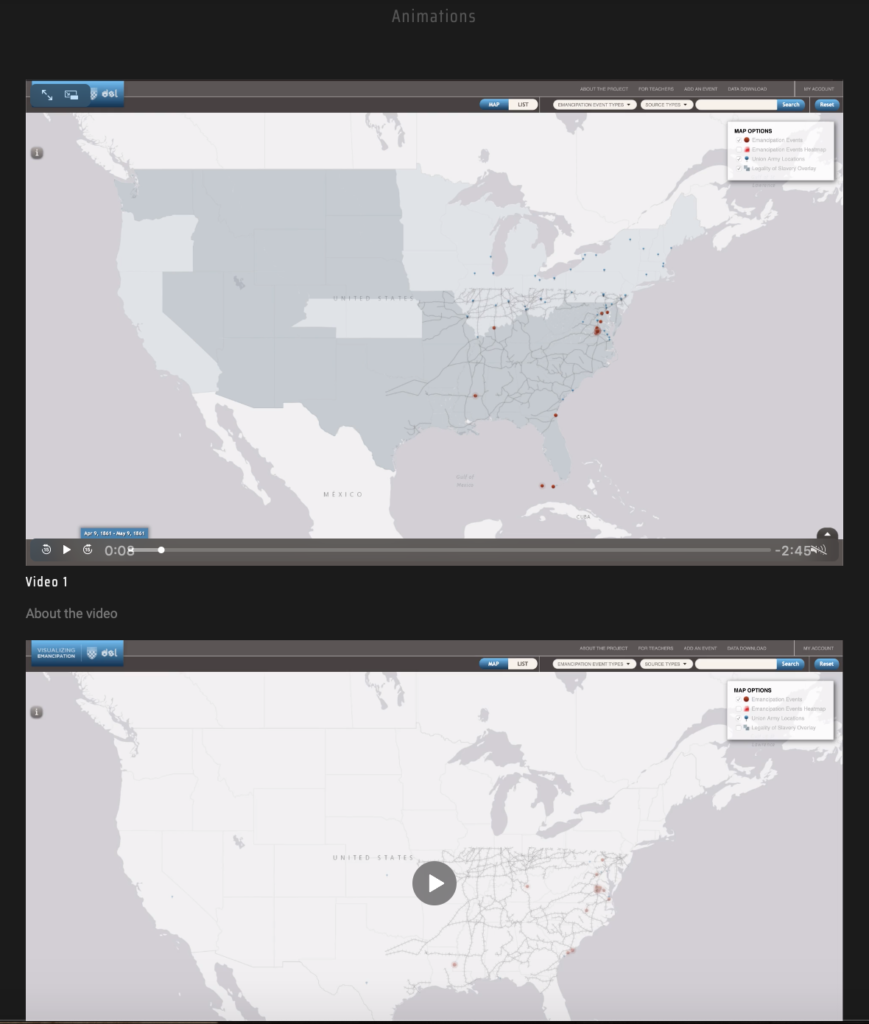
figure 4.e
Finally, we ask about creators: identify who worked on this project and in what capacity. There is a lengthy section of the website under ‘Credits’ that elaborately details every individual and department who was involved in this project. The introduction to this section gives a general description, while the rest of the section discusses in detail what each person or department was responsible for in their entirety. (figure 5.a)
References:
McClurken, Jeff, ed. “Digital History Reviews: Guidelines.” Organization of American Historians (OAH), September 2013. https://jah.oah.org/submit/digital-history-reviews/.
Nesbit, Scott, et.al “Visualizing Emancipation.” University of Richmond, Digital Scholarship Lab, 2020. https://dsl.richmond.edu/emancipation/#contact.
Hey Alexandra!
This was a really well done post. It was full of info and the pictures made it clear what you were talking about in each section. I agree with you that this website was really well organized, aside from the long scrolling home page. It was a very pleasantly organized website and the sections were clear. I wonder if this would be a good model for our own projects.
Alex,
You did an awesome job with your blog post. I really liked how you included a lot of graphics because I was able to correlate them to what you wrote. I thought the one long page on this website was also quite tiresome. I also liked that this website had a map, that was one unique feature to most of the websites we looked at. I can’t wait to see how your project turns out later in the semester!